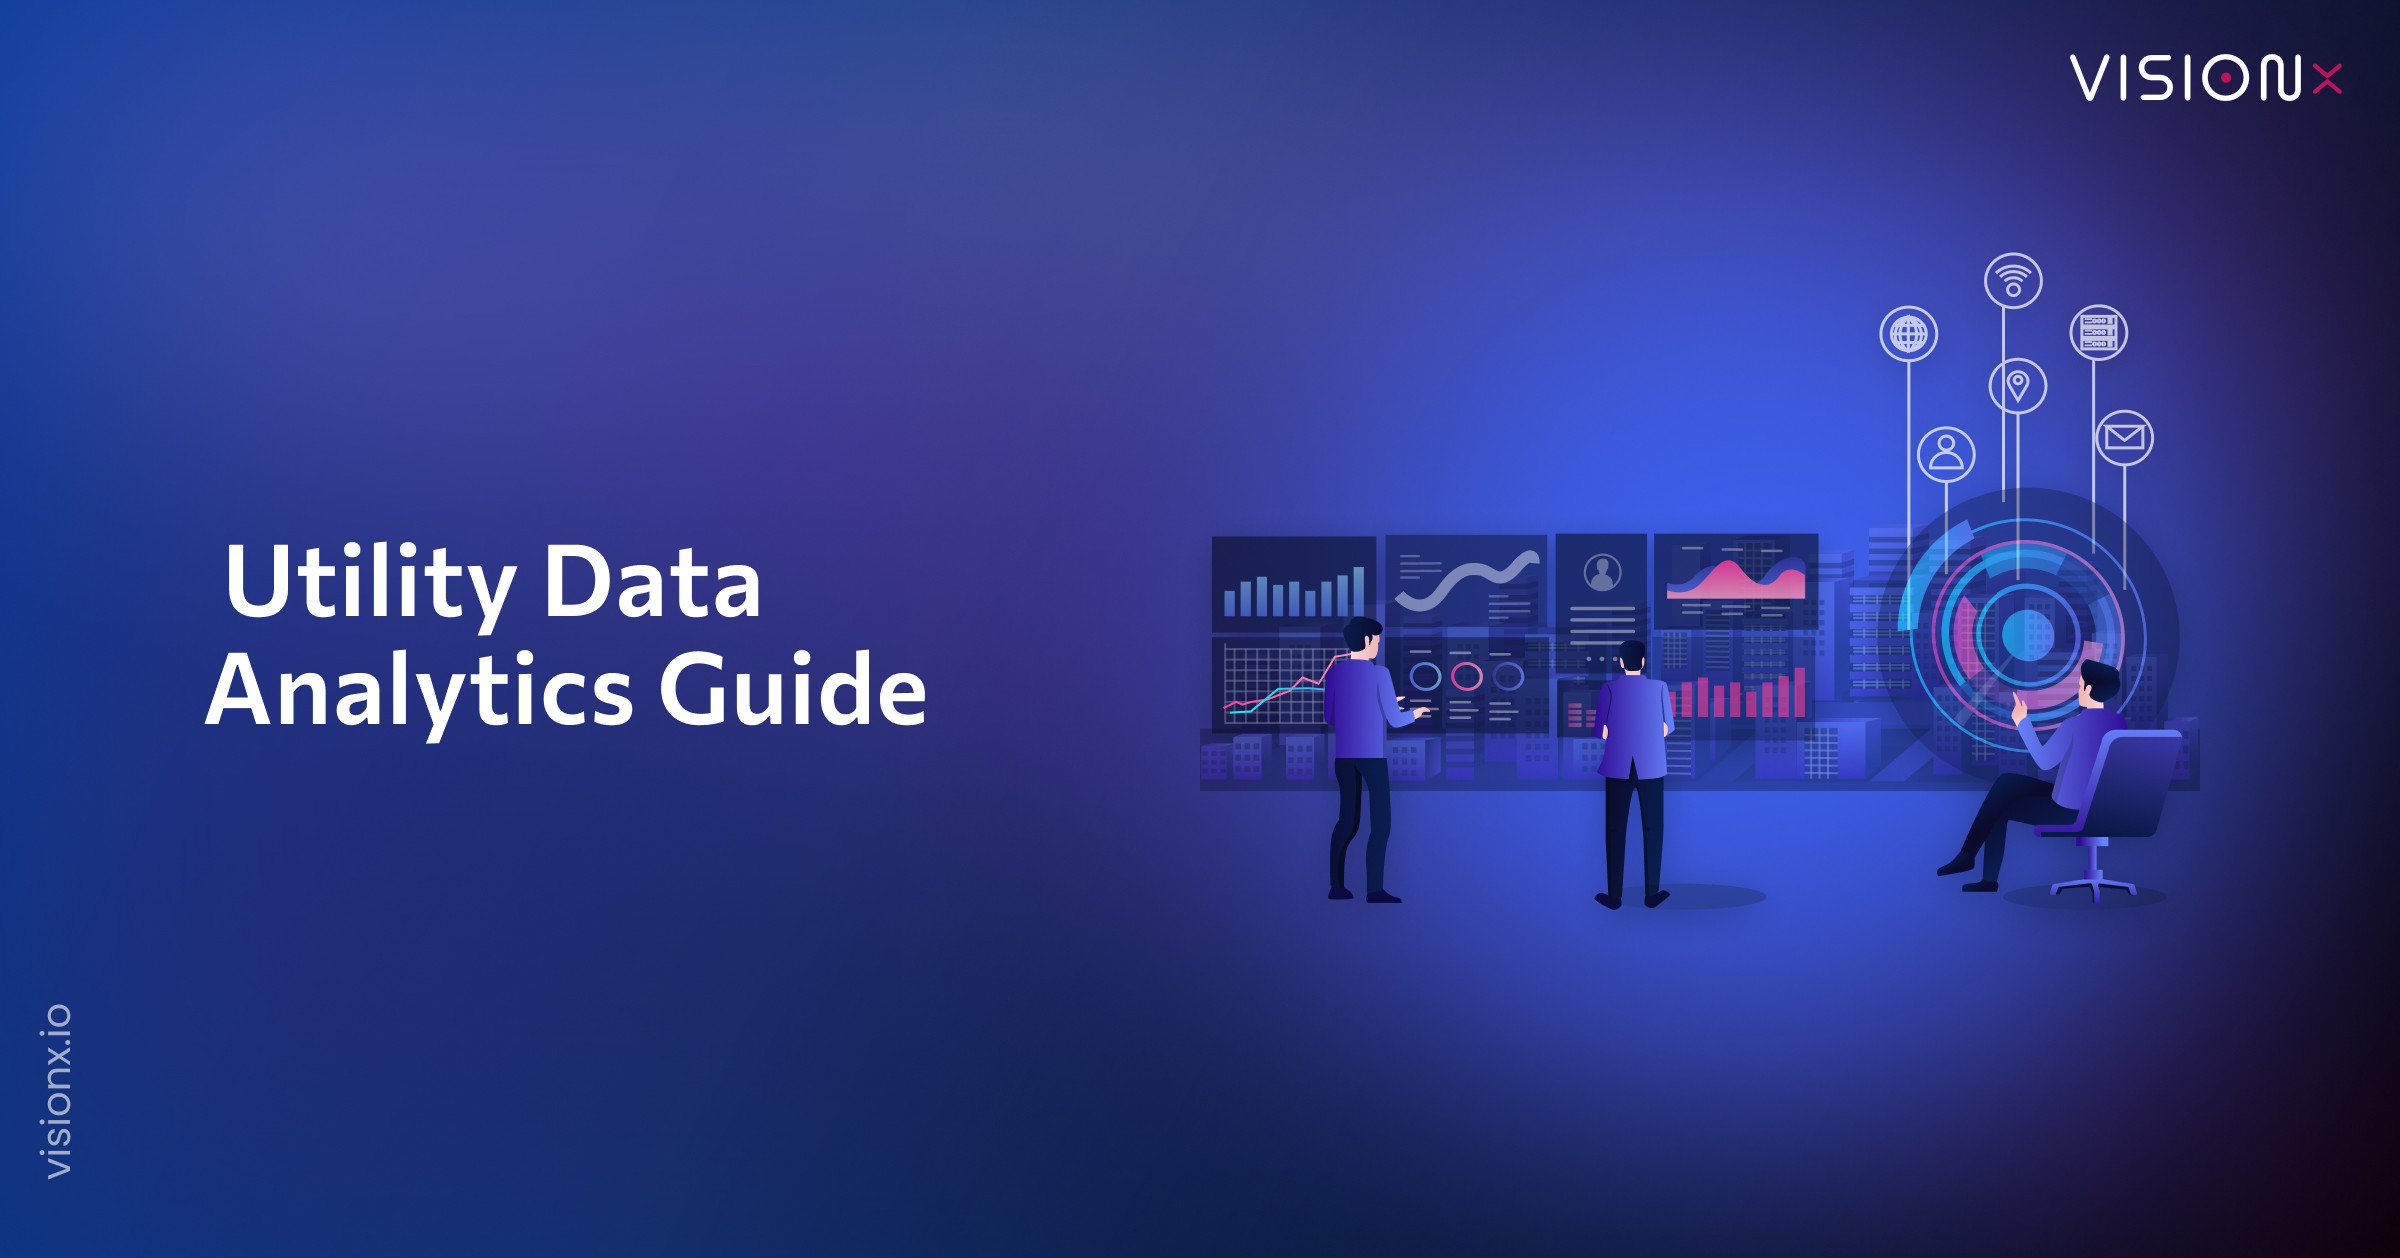
The utility networks of today provide us with a continuous stream of data, generating terabytes of data from smart meters and grid sensors every day. This data arrives at a critical time because utility companies are under more pressure than they have ever been. Their systems are aging, the transition to renewables is adding complexity, customers want greater reliability, and climate volatility is creating additional risk.
So, to address this problem, companies need to take a new approach, which is utility data analytics. This capability underpins any utility’s aspiration to be resilient and efficient. It creates actionable insight from the massive amounts of data. For example, one utility that engaged in asset management using advanced analytics reduced its operating expenses by 20 to 25% and its capital expenditures by 40 to 60%, according to McKinsey.
This guide will walk you through that transformation, from what utility data analytics is and its core components to a practical implementation plan, because the goal is to build a truly data-intelligent utility at every level of the organization.
Key Takeaways
- Utility data analytics is the process of collecting, analyzing, and interpreting data from utility systems to improve operational efficiency, reliability, and business decision-making.
- Integrating data from smart meters, sensors, billing systems, and external sources gives utilities a complete operational view and enables more accurate forecasting.
- AI and predictive analytics help utilities anticipate equipment failures, forecast demand, detect anomalies, and respond to outages before they escalate into costly disruptions.
- Successful implementation requires clean data, scalable infrastructure, and the right analytics platform, supported by a data-driven culture across the organization.
- Modern utility analytics improves efficiency, strengthens grid resilience, enhances customer service, and supports the transition to a smarter, more sustainable utility network.
What is Utility Data Analytics?
Utility data analytics is the process of collecting, organizing, and analyzing data generated by utility systems such as electricity, water, natural gas, and district energy to improve operational efficiency, reduce costs, enhance reliability, and support better business decisions.
Utilities generate vast amounts of data from smart meters, sensors, SCADA systems, IoT devices, billing platforms, GIS, weather services, and customer interactions. Utility data analytics transforms this raw data into actionable insights that help utilities optimize their infrastructure and services.
While older business intelligence tools can tell you what happened last week, utilities AI explains why it happened. This deeper understanding then allows for utility predictive analytics, which forecasts what is likely to occur next. This shift from hindsight to foresight is the entire goal of analytics for utilities today.
Why Utility Data Analytics Matters for Modern Utilities?
Today’s utility companies are managing within a complicated environment. Infrastructure is old, the uncertainty of customer demand increases, and multiple layers of regulatory and public pressure for sustainable practice continue to develop. These issues can seem impossible to manage with old methods.
This is the precise reason utility data analytics matters now more than ever. The global utility analytics market confirms this change, as it is expected to grow to over $13 billion by 2032.
This growth happens because utility data analytics provides direct answers to these challenges. Utilities can transition from a reactive fix approach to a proactive management approach by utilizing AI and machine learning techniques on both historical and real-time data. This capability creates the basis for a resilient and data-driven organization.
The practical applications are clear and impactful
- Utility predictive analytics predicts precise energy usage patterns to balance the grid.
- It detects subtle anomalies in water flow that signal a main break.
- Utility analytics identifies equipment at high risk of failure for targeted repair.
These use cases are powered by broader industry trends. The rise of IoT sensors, smart grids, and digital twins provides the raw utilities data, while advanced utilities AI provides the intelligence to interpret it. This entire ecosystem relies on a solid utility data analysis foundation. For any utility company, the path forward is built on utility data analytics.
Utility Analytics vs. Energy Management Software: What’s the Difference?
One of the most common points of confusion for utility teams evaluating new tools is utility analytics vs energy management software. The two are complementary, but they solve different problems, and understanding the distinction helps you buy – or build – the right platform.
| Aspects | Utility Analytics Software | Energy Management Software (EMS) |
| Primary purpose | Interprets historical and real-time data to generate insight | Monitors and actively controls energy generation, storage, and distribution |
| Core question answered | “What does this data tell us, and what should we do next?” | “How do we balance load and dispatch energy right now?” |
| Typical users | Data teams, asset managers, planners, executives | Grid operators, dispatchers, control room staff |
| Output | Dashboards, forecasts, anomaly alerts, reports | Real-time control commands, load balancing actions |
| Time horizon | Historical trends plus short- and long-term forecasting | Real-time and near-real-time operational control |
| Examples of use | Predictive maintenance analytics for utilities, smart meter data analytics, load forecasting | SCADA-driven dispatch, demand response execution, DERMS |
In practice, the best utility analytics software often feeds insight directly into an EMS, so the forecasts and anomaly detection produced by analytics in utilities platforms inform the real-time decisions an EMS executes. Utilities rarely need to choose one over the other, most mature utility data management strategies run both in tandem.
Core Data Sources for Utility Data Analytics
Successful utilities data analytics depends on combining multiple data sources.
- The Grid’s Pulse (Operational Data): This is real-time information from the field, which includes smart meters, SCADA, and grid sensors. It is the live feed of your system’s health, and it’s the foundation of any smart meter data analytics program.
- The Business Record (Information Data): This comes from your core systems, like customer information, billing, and asset management, the backbone of utility customer analytics. It provides the context behind the grid’s activity.
- The Outside World (External Data): This includes weather forecasts, geographic maps, and market prices. These external factors have a direct impact on your operations and are essential inputs for electric utility load forecasting software.
When these separate streams are woven together, they form a complete picture that empowers a truly data-driven approach, which is why the energy and utility analytics market continues to grow as more companies seek this capability.
The Core Components of a Utility Analytics Framework
A successful framework for utility data analytics is built on four connected layers. Each layer must be strong for the entire system to work.
1. Data Sources and Ingestion
The first step is the foundation, and it starts with the constant flow of data from across your operations. This utility data comes from many separate systems, such as;
- Smart meters and grid sensors
- Customer information and billing systems
- External sources like weather forecasts
The initial task is to gather all these scattered streams into one place, which creates the base dataset for all subsequent analysis.
2. Data Management and Integration
The collection of this diverse data demands a strong backbone to support it. A main data storage, such as a cloud data warehouse, is very important because it can manage large amounts and different types of information, which includes both structured and unstructured data. This layer is the heart of utility data management.
At this point, the data is transformed by being cleaned, standardized, and merged. The accuracy and reliability needed for the power companies to do their energy data analytics effectively are provided by this very important preparation. This stage ensures high-quality utilities data for AI models and reporting.
3. Analytics and AI Models
With clean, integrated data, the next step is the intelligence engine. Utilities AI and machine learning models process the prepared data to find answers.
- Descriptive: Reports what happened on a utility analytics dashboard.
- Diagnostic: Analyzes why an event occurred.
- Predictive: Uses utility predictive analytics to forecast future events like demand spikes.
- Prescriptive: Recommends the best action to take.
4. Visualization and Action
The final layer delivers these insights back to your teams through a clear interface. Purposeful utility analytics dashboards depict complicated findings in a straightforward way for field crews and executives. This vital last step completes the loop by turning complex analysis into timely, operational decision-making, making the whole organization data-driven.
Clear visualization enables faster decisions while strengthening utility business intelligence across the organization.
Key Benefits of Utility Data Analytics
The initiative to implement utility data analytics stems from obvious and immediate operational advantages. This is a current necessity for any company in the utility industry that wants to be competitive and dependable. The benefits of utility data analytics reach across the entire organization, from the control room to the customer.
Enhanced Grid Reliability & Resilience
One of the major advantages is the development of a grid that is tougher and more resilient. Data analysis by utilities AI helps anticipate and prevent equipment breakdowns before they lead to power cuts for customers. This strategy of being active not only reflects positively on the main reliability indicators, such as SAIDI and SAIFI, but also results in reduced power outages and a network that can endure stress better.
Improved Operational Efficiency
These tools also deliver major gains in operational efficiency.. With utilities AI, dispatch of field crews can be optimized, making sure that the most suitable team is sent to the most appropriate place. It has the capability to point out the spots of non-technical loss, and it schedules maintenance automatically, thereby extending asset life and cutting down on manual monitoring.
Integration of Renewable Energy
For utilities adding renewable sources, data analytics in utilities is essential. It precisely predicts solar and wind production, which are both very variable. This foresight is essential to maintain grid stability as more green energy enters the grid, making utilities AI a key partner in the energy transition.
Elevated Customer Experience
The benefits also extend directly to the customer. Utility customer analytics enables detailed usage insights and personalized rate plans like Time-of-Use. Furthermore, it allows for proactive outage communication, with accurate restoration times that build trust and satisfaction, ultimately improving the overall utility experience for the people a utility serves.
Risk Mitigation and Safety
Lastly, one of the main advantages is the increased safety. Utility predictive analytics can detect risks such as vegetation encroachment or transformer overloading well in advance of any safety situation. Proactively managing risk provides safety for both the public and essential infrastructure.
Practical Use Cases of Utility Data Analytics
The following are some of the most powerful utility data analytics use cases.
1. Predictive Maintenance
By processing sensor data from transformers and switches, utility data analytics powers real predictive maintenance analytics for utilities. Through this method, the apparatus with a high failure probability is detected, which gives the team the chance to carry out the much-dreaded repairs before the cut-off happens. Thus, by this method, costly interruptions are avoided and the service life of the most important grid assets is increased.
2. Load Forecasting & Demand Response
It is important to predict demand accurately in order to assure grid stability. Utilities utilize electric utility load forecasting software to analyze historical consumption patterns with contemporaneous weather data to produce accurate load forecasts.
This results in more efficient generation planning and allows customers to properly participate in demand response programs to reduce usage during high-demand times and help balance the entire system.
3. Theft Detection & Revenue Protection
Non-technical losses, which are energy theft, are often a drain on financial resources. Advanced utilities analytics applies anomaly detection algorithms to smart meter data. The systems will flag non-patterns of consumption that suggest bypassing or tampering, enabling investigators to pursue their investigation and protect important revenue.
Learn more about AI-driven fraud detection in our guide on Financial Fraud Detection with AI.
4. Outage Management & Restoration
In case of outages, speed is of utmost importance. Contemporary utility analytics dashboards bring together data from grid instruments, weather forecasts, and consumer complaints in real-time.
This amalgamation of data can foresee the failure site, evaluate how many customers are impacted, and send the nearest and best-suited team to the site. All of this leads to a much faster and more efficient restoration process.
5. Vegetation Management
It is a frequent hassle to handle the plants close to the electric wires. With the help of utility AI, a data analytics company can pinpoint specific trees or branches from the satellite and aerial images that present a very high risk of contact. Therefore, it leads to an efficient and budget-friendly cutting program that almost completely prevents power interruptions due to plants.
Real-Time Utility Analytics Dashboards & Software Tools
Insight is only useful if the right people can see it fast enough to act. That’s why a real-time energy consumption dashboard has become a standard requirement for any modern utility business intelligence stack, and why most utilities run their utility data analytics through purpose-built software rather than static reports.
Most utility analytics software platforms organize dashboards around the specific decisions different teams need to make:
- Customer dashboards: Surface critical and priority accounts along with real-time usage details, supporting stronger utility customer analytics.
- Crew dashboards: Track field crew availability, shift status, and assignment location for faster response.
- Outage dashboards: Combine storm paths, equipment failure signals, and customer-reported outages into one view.
- AMI (Advanced Metering Infrastructure) dashboards: Surface smart meter data analytics on consumption trends, costs, and anomalies.
- ETR dashboards: Compare system-generated versus crew-estimated restoration times so utilities can communicate accurately with customers.
When evaluating the best utility analytics software, look for platforms that can ingest data from your NMS, OMS, and CIS simultaneously, siloed data is the biggest obstacle to a usable real-time energy consumption dashboard. Dashboards should also align with regulatory reporting standards like SAIDI, CAIDI, and SAIFI, since regulators review reliability data too.
Choosing the Best Utility Analytics Software
Organizations evaluating best utility analytics software should focus on business value rather than features alone.
Key Evaluation Criteria
| Capability | Why It Matters |
| AI & machine learning | Supports predictive insights |
| Smart meter integration | Enables smart meter data analytics |
| Cloud scalability | Handles growing utilities data volumes |
| Dashboard customization | Improves decision-making |
| Forecasting tools | Supports electric utility load forecasting software capabilities |
| Security & compliance | Protects sensitive operational data |
The right utility analytics software should integrate with existing systems while supporting utility business intelligence, predictive maintenance, and future AI initiatives.
A 5-Step Implementation Plan for Utility Data Analytics
Implementing utility data analytics necessitates a transparent and intentional strategy. This implementation plan offers a systematically laid-out route to transition from idea to operational worth, making sure that your investment produces real outcomes.
Step 1: Define Business Objectives & Secure Sponsorship
Any successful initiative does not start with a particular technology but with a clear business objective. The first step is to establish a targeted problem, such as cutting down on the outage time by a certain percentage.
This tangible goal then offers the focus to the whole project, and therefore, executive sponsorship and funding at this tender stage will be necessary, as they will be the ones who will steer the required organizational changes.
Step 2: Assess Data Readiness and Infrastructure
After identifying your objective, you have to analyze your raw material: data. This starts with a proper audit of the utilities data to know what you have, where it is stored, and the quality of the information. With this evaluation, you should also examine your existing data architecture since a scalable platform is frequently needed to facilitate the activity of a utility data analytics firm or an internal group.
Step 3: Build or Buy? Choosing the Right Technology Platform
Having known your data landscape, now you have a strategic, critical decision to make. You have to make a choice about creating an internal analytics solution or buying one from a special vendor. This critical move depends on a number of aspects, such as long-term scalability, total cost of ownership, and availability of in-house technical expertise in data analytics in utilities.
Step 4: Start Small with a Pilot Project
Before attempting to roll it out on a grand scale, it would be more prudent to choose a small, high-value pilot project. A perfect candidate would be predictive maintenance of one substation. This narrow scope can enable you to prove a quick win, and this creates confidence in the utility data analytics process and the lesson it teaches before you can invest in a broader deployment.
Step 5: Scale, Iterate, and Foster a Data Culture
Once your pilot has been successful, the interest thereupon is directed to expansion. The known solution can then be scaled to other business areas. This step involves both continuous iteration and a focused endeavor to build a culture of data. You have to invest in training and influence all teams to make decisions based on the information provided by utility analytics dashboards.
How VisionX Helps Utilities Modernize Through AI and Data Insights
VisionX is a leading AI development company that enables utilities to convert complex operational data into operational intelligence. We combine AI, business intelligence, and data engineering to assist modern utilities in improving their decision-making, efficiency, and reliability.
With VisionX, utilities can:
- Use AI-based analytics to forecast demand, identify anomalies, and optimize grid operations.
- Create bespoke data systems and dashboards to have live visibility on assets and systems.
- Predictive maintenance and workflow automation through machine learning and intelligent process engineering.
Collaborate with VisionX to incorporate modern analytics for utilities into all of your business workflows and optimize your path to a smarter, more sustainable, and data-driven utility.
FAQs
What is utility data?
Utility data includes information collected from smart meters, SCADA systems, IoT sensors, billing platforms, GIS systems, customer interactions, and weather services. This data powers modern utilities data analytics initiatives.
How do utilities use data analytics?
Utilities use analytics for demand forecasting, predictive maintenance, outage management, customer analytics, fraud detection, and asset optimization. AI also helps automate operational decisions using real-time data.
What are the 5 P's of data analytics?
Purpose (the business goal), People (who has the right skills), Processes (how work gets done), Platforms (the technology), and Performance (tracking results). It's a simple checklist for keeping data analytics in utilities grounded in outcomes, not just tools.
What is the role of data analytics in utility management?
The role of data analytics is to convert raw data into actionable insights for better decisions. It moves utility management from reactive problem-solving to proactive planning. This shift is central to the work of a modern utility data analytics company, enabling improved reliability and efficiency across the organization.
How does data analytics impact energy and utilities?
It improves grid reliability by catching equipment failures early, sharpens resource allocation, and makes it easier to fold renewable sources into the grid safely. That's the pull behind the growth in the utility data analytics market.
What is the role of AI in utility analytics?
Utilities AI improves forecasting, automates anomaly detection, enables predictive maintenance, and supports faster operational decisions. AI is becoming a core component of modern energy and utility analytics platforms.