A globally renowned fast-food corporation McDonald’s faced a significant challenge. They struggled to evaluate the productivity of their outsourced development teams. Without a consolidated monitoring system, oversight became nearly impossible.
The operations of these distant teams were dispersed due to their complex hierarchies and subgroup structures. This lack of transparency prevented the company from tracking work activities across different levels. As a result, they could not make data-driven decisions or execute strategic shifts to stay competitive.
To tackle this issue, the company collaborated with VisionX on the Product Excellence project. The goal of this project was to implement an end-to-end monitoring system that would give insight into outsourced teams’ productivity.
The goal was to equip leadership with the insights necessary to assess performance, enhance accountability, and make informed choices. Through this partnership, McDonald’s leadership took bold action to transform their approach to manage external development and setting a new standard for operational excellence.
The Product Excellence initiative introduced an innovative approach for assessing and improving product quality and the potential of international development teams. This project aimed to elevate productivity, ensure superior quality, and maximize business value by integrating analytics within an agile framework.
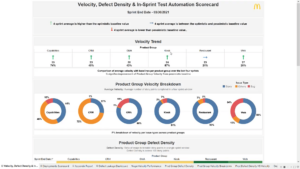
During the transformational phase, VisionX played an essential role by identifying important KPIs (Key Performance Indicators) related to agile methodologies, such as code quality, speed, and automation. These KPIs were strategically chosen to assess the effectiveness of the partnership with the outsourced development firm.
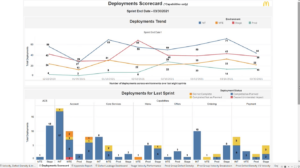
Evaluating these KPIs involved a detailed analysis through measurable metrics like velocity, defect density, and test automation. These metrics, calculated using industry-standard formulas, provided a solid foundation for assessment. The necessary data for these calculations were sourced from the company’s agile tools, like Jira, and were then translated into actionable insights via Tableau reports. This enabled the monitoring of critical aspects such as delivery velocity, code quality, test automation, and deployment procedures.
This strategic approach effectively addressed several significant challenges across 57 development teams. It pinpointed process gaps, established robust monitoring mechanisms, standardized velocity measures, refined effort estimations, and significantly improved code quality. It also addressed problems with inconsistent quality and group performance, a significant step forward in pursuing operational excellence and higher-quality products.
Here are the key features of the dashboard:
The operations of our client have been fundamentally changed by the implementation of a reporting dashboard.
Firstly, it has improved efficiency, accountability, and team dynamics by simplifying the deliverables process. This organizational change resulted in a remarkable productivity and quality boost of 25% velocity and 15% code quality improvement. Furthermore, deployments that directly impacted customers decreased by 17%, improving the customer experience. Additionally, the reports enabled quicker feature rollout, which allows global market expansion.
Ultimately, this solution improved the organization’s operations and competitiveness in the market on all fronts. The magnitude of these improvements highlights the immense value and impact of the reporting strategies and solutions implemented. This comprehensive reporting approach has been a game-changer, catalyzing operational excellence.