
As you build more complex React Native apps, bugs, and performance issues are inevitable. Thankfully, React Native provides powerful built-in debugging tools to help troubleshoot these problems quickly. The React Native debugger is an indispensable tool for any React Native developer.
This guide will cover how to use the React Native debugger to squash bugs and optimize your React Native apps.
Overview of the React Native Debugger
The React Native debugger is a tool designed to assist developers in troubleshooting and debugging React Native applications. It is a standalone app that lets you inspect and debug React Native apps on simulators and devices. Here are some key capabilities it provides:
– View component hierarchies
– Inspect state and props
– Live-edit styles
– Set performance monitors
– Debug JavaScript code
– Track network requests
– Replay actions
It connects to a running React Native app via WebSocket and uses Chrome Developer Tools under the hood for its UI. The React Native debugger is invaluable for visualizing and diagnosing issues in real time.
Why use a React Native Debugger?
There are several reasons to use the React Native debugger:
Real-Time Debugging
The React Native debugger allows developers to debug their applications in real-time. You can set breakpoints, inspect variables, and step through your code as it’s running on a simulator or a physical device. This is invaluable for identifying and fixing bugs in your code.
JavaScript Debugging
Since React Native apps are primarily built using JavaScript, the React Native debugger provides a JavaScript debugger, which allows you to view call stacks and inspect variables within your JavaScript code. This is especially helpful for tracking down logic errors and unexpected behavior in your app.
UI Inspection
React Native debugger includes tools for inspecting the user interface of your app. You can view the hierarchy of UI components, inspect their properties, and even make on-the-fly changes to see how they affect your app’s appearance. This is crucial for UI debugging and fine-tuning.
Performance Profiling
The debugger also offers performance profiling tools, which allow you to identify performance bottlenecks and optimize your app for better performance. You can profile CPU and memory usage, network requests, and more.
Hot Reloading
React Native debugger often comes with hot reloading support. This means that you can make changes to your code, and the debugger will automatically reload the modified parts of your app, allowing you to see the results of your changes without having to manually refresh the app.
Integration with React DevTools
React Native debugger can be integrated with React DevTools, which provides additional tools for inspecting and debugging React components in your app.
How to use the React Native debugger:
Using the React Native debugger involves a few steps, including installation, enabling debug mode in your React Native app, and connecting to the debugger. Here’s a step-by-step guide on how to use the React Native debugger:
Step 1: Install the React Native Debugger
You can install the React Native Debugger tool using npm or yarn. It’s recommended to use npm for this purpose. Open your terminal and run the following command:
![]()
Step 2: Enable Debug Mode in Your React Native App:
In your React Native app development code, you need to enable debug mode. This typically involves a few steps:
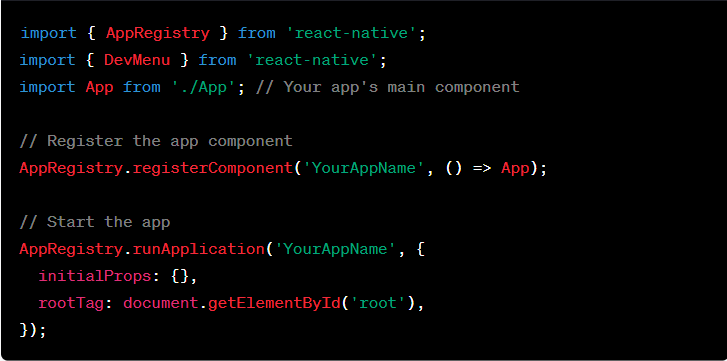
- Import the DevMenu module from react-native in your entry file (usually index.js or App.js):
- You can activate debug mode by shaking the device (or using the simulator’s shake gesture) or by pressing Ctrl + M in the emulator. This will open the Developer Menu.
- In the Developer Menu, select “Debug JS Remotely.” This will start the debugging server.
Step 3: Connect to the React Native Debugger:
Now that you have enabled debug mode in your app, you need to connect to the React Native Debugger tool:
- Launch the React Native Debugger tool from your applications or terminal

- This will open the React Native Debugger window.
- Inside the React Native Debugger window, you may need to configure settings such as the host and port for the debugger. By default, it should be set to localhost and port 19001 for Expo projects or 8081 for standard React Native projects.
- Click the “Start Remote JS Debugging” button in the React Native Debugger. This will initiate a connection to your running React Native app.
Step 4: Use the Debugger to Troubleshoot Your App:
With the connection established, you can now use the React Native Debugger for various debugging tasks, including
- Setting breakpoints in your JavaScript code by clicking in the gutter of your code editor or using the debugger statement.
- Inspecting the values of variables and expressions during debugging sessions.
- Use the Developer Menu in your app to access additional debugging tools like “Reload,” “Toggle Inspector” for UI inspection, and “Performance” for profiling.
- Access the React DevTools if you’ve integrated them into your project for React component debugging.
- Utilizing the “Console” tab to view console.log output and error messages.
- Profiling and monitoring performance using the “Profiler” and “Network” tabs for network requests.
Using React Native Debugger Components Tab
The Components tab in the React Native debugger shows the component hierarchy, props, and state. This is useful for visualizing how your UI is structured and what data is flowing through it.
You can inspect any component to see its current props and state. For example, you may have a `<Button>` component that is not working correctly:
Inspecting this would show the props like the button’s `title` and any state driving its behavior.
You can even live-edit component props and state and see these changes reflected instantly!
The Components tab is invaluable for understanding your React Native UI code and debugging issues.
Debugging React Native Performance with DevTools
The React Native debugger includes full Chrome DevTools to help debug performance problems.
For example, you can profile JavaScript execution times in the Performance tab. This shows you slow functions that may benefit from optimization:
The Memory tab helps uncover memory leaks by recording heap snapshots over time. And the Network tab analyzes network requests made by your React Native app.
DevTools combined with React Native debugging provides end-to-end performance insights.
Using the React Native Debugger Redux Tab
If your React Native app uses Redux for state management, the Redux tab in the debugger is extremely helpful.
It lets you inspect every action dispatched, see how the state changes over time, and visualize the reducers involved.
You can also travel backward and forward in time by “replaying” actions.
This Redux debugger integration makes tracking down state bugs much faster.
Debugging JavaScript Code in React Native
To debug JavaScript code like business logic, you can set breakpoints directly in the debugger’s Source tab.
When the breakpoint hits, code execution will pause, allowing you to inspect variables, run commands, and step through the code line-by-line to see what’s happening under the hood.
For example, you may set a breakpoint in a button’s `onPress` handler that contains a bug:
The React Native debugger, combined with breakpoints, provides a full JavaScript debugging workflow.
Additional Tips for Debugging React Native Apps
Here are some more tips for debugging React Native apps efficiently:
- Use `console.log()` statements and the Console tab for logging.
- Enable Remote Debugging to debug apps running on real devices.
- Try Hot Reloading to test code changes quickly.
- Add yellow box warnings to catch common errors.
- Leverage debugger statements like `debugger;` to pause execution.
- Enable Fast Refresh to speed up incremental builds.
And refer to the official debugging docs, which cover even more use cases.
The React Native debugger, console logs, and other debug APIs will help you squash any bug virtually!
Key Benefits of the React Native Debugger
To summarize, here are some of the main benefits of the React Native debugger:
- View component trees to understand UI structure
- Inspect props and state driving your app
- Debug Redux actions and state changes
- Diagnose performance issues with profiling
- Set breakpoints and debug JavaScript code
- Edit styles and see changes instantly
This tool is invaluable for tracking down React Native issues quickly and resolving them. No more guessing about what’s happening inside your app!
Conclusion
Debugging React Native apps effectively is essential as you build and maintain apps over time. The official React Native debugger provides Chrome DevTools capabilities customized for React Native needs.
Utilize its tabs for Components, Redux, DevTools, and Debugging JavaScript to gain key insights into your app. Using the React Native debugger will speed up development, reduce bugs, and lead to better optimized React Native experiences.